Fractal DimensionFractal Dimension of Coastlines
Fractal Dimension is an interesting concept when applied to abstract geometric fractals such as the Sierpinski Triangle and the Menger Sponge. But to derive the dimension, we
need to determine how the patterns scale as we magnify them. This is relatively easy for perfect geometric fractals. In this section, we will learn a
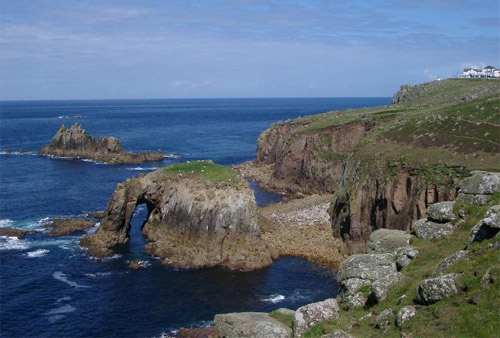
method for estimating the fractal dimension of real objects such as coastlines. Recall from the chapter on Fractal Geography that a coastline - such as that of Britain - shows more and more detail the closer we zoom into it. If we ask "How long is the coast of Britain," the answer is that it depends on how closely you look at it, or how long your measuring stick is. If you measure the coastline by taking a map and placing a ruler around the edge you can get a certain value for the perimeter. But if you were to walk around the beaches of Britain and add up all your steps, you'd arrive at a very different (and larger) perimeter. But that value is also an approximation. To get a more accurate value, you'd have to measure the length around every boulder, and every rock, every pebble, and even every grain of sand. And at a microscopic level, sand is a fractal as well, and cannot be easily measured. The answer is: the coastline gets longer and longer as you measure it more closely, and it approaches infinity. This is why the fractal dimension is a very useful concept to describe a coastline.
To derive the dimension, we'll use a similar method as for the geometric fractals, and we'll see how the measured length changes as a function of scale. To
do this, we'll need to measure the perimeter using rulers of different lengths. To be consistent, we're actually going to define r to be the magnification factor, which is the
inverse of the ruler length.
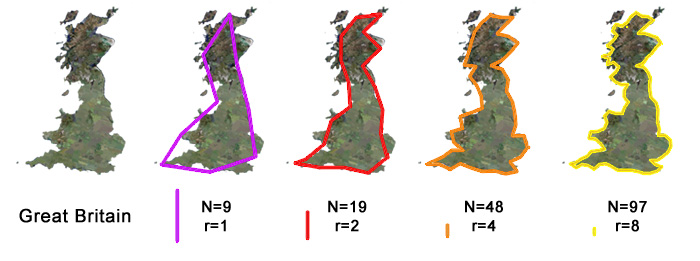
When we use a large ruler (r=1, a small magnification factor), we get a very poor approximation, shown in purple, and a value for the perimeter of N=9. As the ruler
length shrinks, the magnification r increases, and the value of the perimeter N increases. We are interested in the rate at which the perimeter changes as a function
of the ruler length. The wigglier the coastline is, the more the perimeter will increase as the ruler shrinks. To better understand the relationship,
we can graph the perimeter versus the magnification factor (or the inverse of the ruler length). Before we do that though, we need to take the logarithm of the measured values. 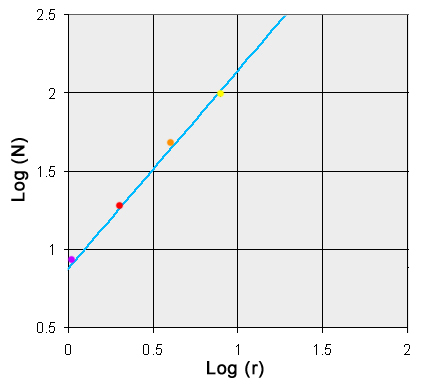 Graph showing the relationship between the measured perimeter (N) and the magnification factor (r). The dots are the same colors as the outlines in the figure above.
To measure the dimension of a coastline we can use a very similar formula as we used for geometric fractals: 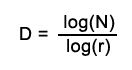
Now there is a very useful reason we take the logarithm of the values before we graph them: It means the points we plot on the graph come out more or less on a straight line. We can use a simple process to find a line (in blue) that best fits the datapoints. The slope of this line tells us how quickly the perimeter changes versus the magnification factor. Slope is simply defined as the change in the Y-value divided by the change in the X-value. If the Y values stay the same, then the slope = 0/X = 0, and the line is flat. If the Y-values change at the same rate as the X-values, then the slope = 1, and the graphed line has an angle of 45 degrees. The fractal dimension of the coastline, D, is simply the slope of the line in the graph above. In this case, we can measure the slope and find it to be approximately 1.21. So according to this analysis, the fractal dimension of Britain, D = 1.21 The lower the dimension, the straighter and smoother the coastline. The higher the dimension the more jagged and wiggly the coastline is. Unlike the case with the geometrical fractals, this way of determining the dimension is clearly an estimate. A more careful analysis of the coastline of Britain found it's dimension to be 1.25 REF While there may be some variability between different computed values of the fractal dimension for a coastline, it is MUCH more accurate than a measurement of the perimeter. And yet, people publish values for the lengths of coastlines all the time! But they usually don't tell you how long the rulers they used were, so the value is virtually meaningless. You can see a list of the lengths of coastlines of various countries around the world, compiled in the CIA World Factbook, but there is no way to really trust this data, since we don't know the ruler size used. The fractal dimension for various coastlines has been calculated, and the some of the values are presented below:REF  [ ]  [ ]  [ ]  [ ] Fractivity: Download and print this one-page PDF coastline measurement exercise. Cutout the enclosed ruler which you will use to measure the coastline of Britain at various ruler lengths. Plot the values you get for the perimeter on the enclosed chart. Enter the value you measured for the perimeter: When the ruler = 10cm, the perimeter = [ ] When the ruler = 5cm, the perimeter = [ ] When the ruler = 2.5cm, the perimeter = [ ] |
|
<- PREVIOUS NEXT -> © Fractal Foundation. |