Fractal DimensionFractal Dimension - Box counting Method
It is relatively easy to determine the fractal dimension of geometric fractals such as the sierpinski triangle. We learned in the last section how to compute
the dimension of a coastline. But not all natural fractals are so easy to measure. In this section, we'll learn a method for computing the dimension of more complicated
fractals.
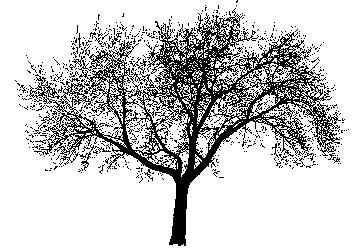 How can we compute the dimension of an object such as the tree above? We will now learn the the Box Counting Method, which is widely used to determine the fractal dimension of objects such as this. The box counting method is analogous to the perimeter measuring method we used for the coastlines. But in this case, we cover the image with a grid, and then count how many boxes of the grid are covering part of the image. Then we do the same thing but using a finer grid with smaller boxes. By shrinking the size of the grid repeatedly, we end up more accurately capturing the structure of the pattern. Using the box counting method, fractal dimension is again the slope of the line when we plot the value of log(N) on the Y-axis against the
value of log(r) on the X-axis. The same equation is used to define the fractal dimension, D. This time, N is the number of boxes that cover the pattern, and r is the magnification, or the inverse of the box size. 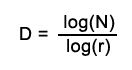 Again, the slope of the line equals the dimension, and it is defined as the amount of change along the Y-axis, divided by the amount of change along the X-axis. Slopes (and dimensions) range between 1 and 2 for this kind of analysis, which corresponds to the range between a line that is straight (dimension = 1) and a line that is so wiggly it completely fills up a 2-Dimensional plane. A steeper slope means that the object is more "fractally", that is, it gains in complexity as the box size decreases. A flatter, lower-valued slope means that the object is closer to a straight-line, less "fractally," and that the amount of detail does not grow as quickly with increasing magnfication.
The applet below let's you discover the dimension of various fractal shapes by counting how many boxes the shapes occupy with different grid sizes. Boxes are colored
blue if they overlap with some of the image, and white if they don't. Play with the applet above. Choose different fractals from the pulldown menu. Click on the buttons labelled from 128 to 1 to cover the image with a grid of the corresponding
size. The number on the button refers to the box size, which is the inverse of the magnification factor. As you click, watch the points appear on the graph, and
the slope of the line that these points fall upon ... is the fractal dimension.
Fractal Dimensions can be very useful. BUT - we must be careful not to place too much trust in a number just because it comes out of a computer with a fancy fractal dimension analysis program. There are many things to be cautious about when interpreting the results. For one thing, remember that we're not really analyzing the fractal dimension of a tree when we plug a picture of a tree into the analyzer above. Rather, we're analyzing the flattened image of a tree. So whereas a real tree has a fractal dimension somewhere between 2 and 3, the flattened image of a tree can only have a dimension between 1 and 2. Nonetheless, we may still be able to use this information. (There are much more complicated fractal dimension analyzers that study volume-filling fractals and use a cubic grid of 3D boxes.) Another thing to be careful of is the method used to prepare the images for analysis. THe world is not all black and white, but rather filled with shades of
gray, (and even colors!) But the dimension analyzer works with black and white images only. So the way you convert a real picture into a black and white image can affect the dimension.
One must be careful about what features of the image to include or to filter out.
Why do we care about the fractal dimension? How is this useful? Why are some rivers twistier than others? How does the branchiness of given species of tree change in different environmental conditions? How can you tell a healthy lung from a sick one in an MRI image? Which kind of soil will a plant grow best in? These are just a few of the countless kinds of questions that scientists can ask - and answer - using the powerful new tool of the fractal dimension. We'll see more examples in the final chapter, on Fractal Applications. But first, we will explore the ancient and timeless appeal of the
Fibonacci fractals, including the universal ratio, the Golden Mean.
|
|
<- PREVIOUS NEXT -> © Fractal Foundation. |